In today’s fast-paced business environment, real-time data visualization tools are critical for organizations that want to make informed decisions quickly and effectively. These tools allow businesses to convert complex data into interactive visual formats that are easy to understand, analyze, and act upon. By leveraging real-time insights, companies can monitor key performance metrics, detect trends, and respond to changes instantly, giving them a competitive edge in their respective markets.
The importance of real-time data visualization tools lies in their ability to provide instant clarity and actionable intelligence. Traditional reporting methods often involve time-consuming processes, resulting in delayed insights that may no longer be relevant. In contrast, real-time visualization ensures that decision-makers have access to the latest data, allowing them to act swiftly on emerging opportunities or potential challenges. This capability is especially critical in industries such as finance, e-commerce, healthcare, and logistics, where timely information can significantly impact outcomes.
Moreover, real-time data visualization tools enable organizations to democratize data across teams. By presenting information in intuitive dashboards and visual formats, employees at all levels can engage with data meaningfully, regardless of their analytical expertise. This accessibility fosters a data-driven culture, encourages collaboration, and ensures that strategic decisions are informed by accurate and up-to-date insights.
Understanding Real-Time Data Visualization Tools
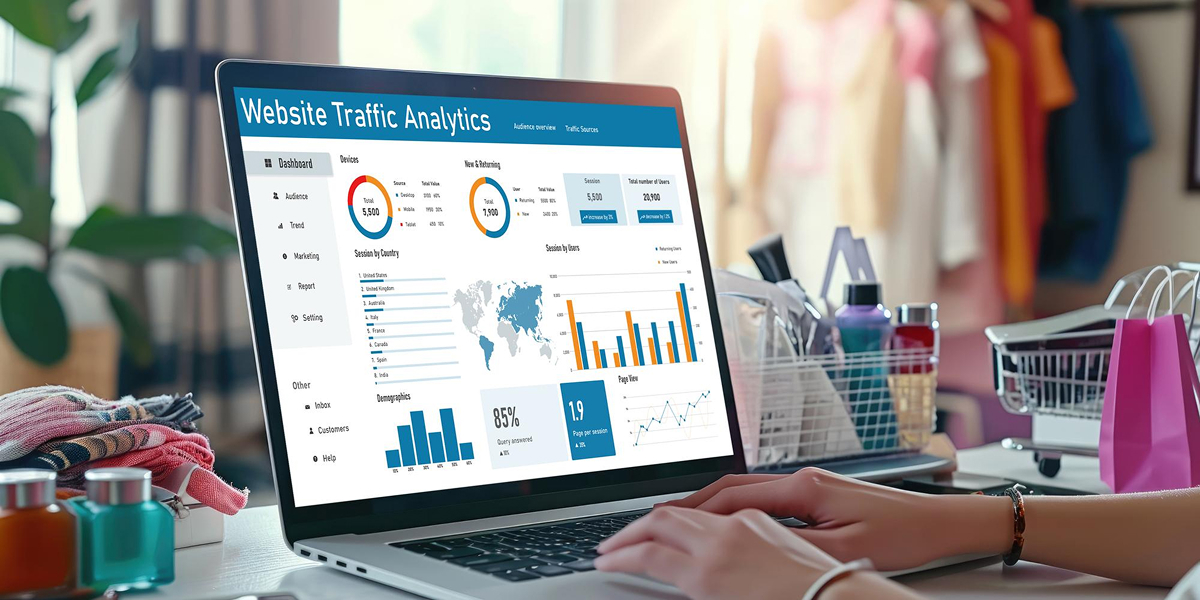
Real-time data visualization tools are software platforms that allow organizations to visualize, monitor, and analyze live data as it is generated. Unlike static reports, which provide snapshots of past performance, these tools continuously update dashboards and visual elements to reflect current conditions.
The primary function of real-time data visualization tools is to simplify complex datasets and reveal actionable patterns. By converting raw data into charts, graphs, heatmaps, and other interactive visualizations, these tools help stakeholders quickly grasp trends, identify anomalies, and understand relationships between variables. This capability is crucial for decision-making, as it reduces the time needed to interpret data and enhances the accuracy of insights.
Key Benefits of Real-Time Data Visualization Tools
Implementing real-time data visualization tools offers numerous advantages that enhance business intelligence and operational efficiency:
- Faster Decision-Making: Instant access to live data allows organizations to respond to changes promptly.
- Improved Data Comprehension: Visual representations make complex datasets easier to understand for non-technical users.
- Proactive Problem Solving: Identify anomalies or potential issues early and take corrective action before they escalate.
- Enhanced Collaboration: Interactive dashboards enable teams to share insights and work collectively on data-driven strategies.
- Data-Driven Culture: Encourages adoption of analytics and evidence-based decision-making across the organization.
- Increased Operational Efficiency: Reduces the time and effort required to generate reports and interpret information.
By leveraging these benefits, organizations can transform data into a strategic asset that drives growth and enhances competitiveness.
Core Features of Real-Time Data Visualization Tools
When selecting a platform for real-time data visualization tools, certain features are critical to ensure usability, scalability, and actionable insights:
- Live Data Integration: Connects seamlessly with multiple data sources, including databases, cloud applications, IoT devices, and APIs.
- Interactive Dashboards: Allows users to explore data dynamically, filter results, and drill down into specific metrics.
- Customizable Visualizations: Offers flexibility to create charts, graphs, heatmaps, and maps tailored to business needs.
- Alerting and Notifications: Triggers real-time alerts for significant changes, anomalies, or thresholds being met.
- Collaboration Features: Supports sharing dashboards and insights across teams with user-friendly permissions.
- Advanced Analytics Support: Includes predictive analytics, trend analysis, and correlation detection capabilities.
These features ensure that real-time data visualization tools provide actionable insights while remaining accessible to a broad range of users.
The Role of Real-Time Data in Business Strategy
Data has become the backbone of modern business strategy, and real-time data visualization tools amplify its impact by providing instant visibility into key metrics. Access to live data enables organizations to monitor performance continuously, optimize operations, and make proactive decisions.
For example, in marketing, real-time dashboards can track campaign performance across channels, allowing teams to adjust targeting, messaging, or budget allocation on the fly. In supply chain management, live data visualizations can highlight bottlenecks or inventory shortages, enabling immediate corrective actions. Similarly, in finance, organizations can monitor cash flow, expenditures, and revenue in real time to ensure financial stability and compliance.
Applications Across Industries

Real-time data visualization tools are highly versatile and can be applied across various industries to drive operational efficiency, strategic decision-making, and customer satisfaction:
- Finance: Monitor transactions, detect fraud, track market trends, and optimize investment strategies.
- Healthcare: Visualize patient data, track treatment outcomes, and manage hospital operations efficiently.
- Retail and E-Commerce: Analyze customer behavior, track sales performance, and optimize inventory management.
- Manufacturing: Monitor production lines, detect equipment anomalies, and improve quality control.
- Logistics and Transportation: Track shipments, monitor delivery routes, and manage fleet performance.
- Telecommunications: Analyze network traffic, monitor service quality, and detect outages in real time.
These applications illustrate the transformative potential of real-time data visualization across diverse sectors.
Challenges in Implementing Real-Time Data Visualization
While the benefits of real-time data visualization tools are significant, organizations may face several challenges during implementation:
- Data Integration Complexity: Combining data from multiple sources can be technically demanding.
- High Data Volume: Processing and visualizing large volumes of real-time data requires robust infrastructure.
- Ensuring Data Accuracy: Real-time insights are only valuable if the underlying data is accurate and reliable.
- User Adoption: Teams may struggle to adapt to new tools without proper training and support.
- Cost Considerations: Advanced real-time visualization platforms may require significant investment in software, hardware, and personnel.
Addressing these challenges requires careful planning, investment in technology, and fostering a culture that values data-driven decision-making.
Best Practices for Leveraging Real-Time Data Visualization
To maximize the impact of real-time data visualization tools, organizations should follow best practices:
- Define Clear Objectives: Identify the key metrics and KPIs that matter most to your business.
- Ensure Data Quality: Implement data governance processes to maintain accuracy, consistency, and completeness.
- Prioritize Usability: Choose tools with intuitive interfaces and interactive features to encourage widespread adoption.
- Integrate Across Systems: Ensure seamless connectivity with all relevant data sources and business applications.
- Monitor Continuously: Regularly review dashboards, adjust visualizations, and refine metrics as needed.
- Encourage Collaboration: Share insights across departments to drive coordinated, data-driven decision-making.
Following these practices ensures that real-time data visualization tools deliver actionable insights and meaningful business outcomes.
Measuring Impact and ROI
The effectiveness of real-time data visualization tools can be measured through various indicators:
- Decision-Making Speed: Reduction in the time required to make informed business decisions.
- Operational Efficiency: Improved workflow, reduced bottlenecks, and optimized resource utilization.
- Revenue Growth: Increased sales, higher conversion rates, and improved profitability.
- Customer Satisfaction: Better understanding of customer needs and timely response to issues.
- Cost Savings: Reduced reporting time, fewer errors, and optimized operational processes.
- Employee Engagement: Increased adoption of data-driven decision-making across teams.
Tracking these metrics ensures that organizations can quantify the value of real-time data visualization and justify investment in the technology.
Future Trends in Real-Time Data Visualization
The field of real-time data visualization tools is rapidly evolving, influenced by technological advancements and changing business needs:
- AI and Machine Learning Integration: Predictive analytics and automated insights enhance decision-making.
- Augmented Analytics: Tools that provide recommendations and insights beyond traditional visualization.
- Cross-Platform Dashboards: Access dashboards seamlessly on desktops, mobile devices, and cloud platforms.
- Enhanced Interactivity: Advanced visualizations with drill-down, filtering, and scenario analysis capabilities.
- Data Democratization: Wider access to real-time insights across organizational levels, encouraging collaborative decision-making.
- Privacy and Compliance: Emphasis on secure handling of real-time data in compliance with GDPR, CCPA, and other regulations.
These trends highlight the growing importance of real-time data visualization in shaping business strategy and enabling organizations to stay competitive.
Conclusion
In conclusion, real-time data visualization tools are transformative assets that empower organizations to turn complex datasets into actionable insights quickly and effectively. By providing immediate visibility into key performance metrics, trends, and anomalies, these tools enhance decision-making, optimize operations, and drive growth.
While challenges such as data integration, infrastructure requirements, and adoption exist, following best practices ensures that organizations can maximize the value of real-time visualization platforms. Companies that leverage these tools can foster a data-driven culture, improve operational efficiency, and achieve better customer outcomes.
Investing in real-time data visualization tools is not merely about technology adoption—it is a strategic initiative that enables businesses to act with speed, precision, and confidence. By embracing these tools, organizations can transform the way they interpret data, make decisions, and compete in an increasingly dynamic marketplace.